
Currently, there are no imminent signs in either timeframe which indicate that the BTC price will manage to reclaim these levels.
Bitcoin Price Shows Bearish Signs at Long-Term Resistance
The weekly timeframe technical analysis for BTC provides a bearish outlook. The main reason for this is the rejection of the $30,500 resistance area and the subsequent decrease (red icon). The rejection also created a long upper wick, considered a sign of selling pressure.
Bitcoin once more validated the $30,500 area as resistance last week (green line). Therefore, the trend is considered bearish until the BTC price breaks out. If it does, a 30% increase to the next resistance at $38,400 will be expected. However, a continued decline could lead to a 14% drop to the next closest support at $25,200.
Check out the Best Crypto Sign-Up Bonuses in 2023
On-chain data suggests that the institutional Bitcoin accumulation phase has ended, contributing to the market inactivity. However, miners have dumped more than 1,400 BTC over the last 24 hours.
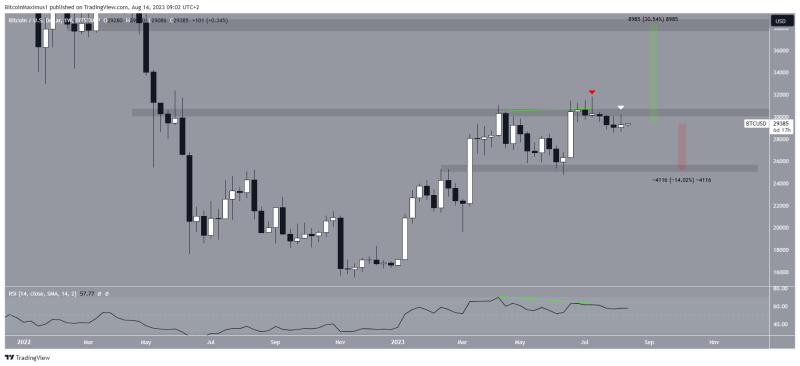
BTC/USD Weekly Chart. Source: TradingView
The weekly RSI is bearish. With the RSI as a momentum indicator, traders can determine whether a market is overbought or oversold and decide whether to accumulate or sell an asset.
If the RSI reading is above 50 and the trend is upward, bulls have an advantage, but if the reading is below 50, the opposite is true. Even though the indicator is above 50, it has generated a bearish divergence (bottom green line) and is falling.
A bearish divergence occurs when a price increase is combined with a momentum decrease. It often precedes bearish trend reversals. The divergence is especially important since it transpires in the weekly timeframe.
BTC Price Prediction: Will Price Reclaim Resistance?
Similarly to the weekly timeframe, the daily one provides a bearish outlook. There are several reasons for this.
Firstly, the daily RSI has generated a bearish divergence (green line). As outlined previously, this is considered a bearish sign, solidified by the fact that the divergence’s trendline is still intact.
Secondly, the price trades below the $29,800 minor resistance area, which has caused two rejections so far (red icons). The area is also very close to the long-term $30,500 resistance.
So, the most likely future price outlook is a decrease to the 0.5 Fib retracement support level, a drop of nearly 4% measuring from the current price. It is still unclear if this will be a temporary support level before a decrease to the long-term $25,250 support or if it will catalyze a bullish trend reversal.
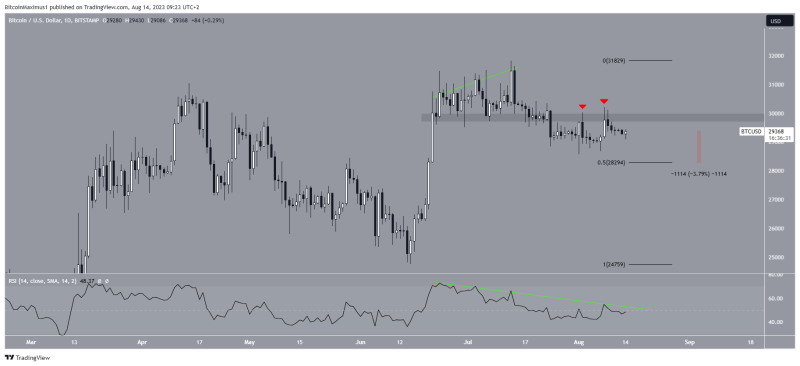
BTC/USD Daily Chart. Source: TradingView
Despite this bearish BTC price prediction, moving above the $29,800 and $30,500 resistance area will mean that the trend is bullish instead. In that case, a 30% increase to the next resistance at $38,400 will be the most likely BTC price prediction.