Link was one of the darlings of the last bull run. It’s story includes crazy volatility, stories of “Link Marines” blowing out Zues Capital out after its short and distort narrative fell apart. I suspect Link will once again be a darling of this new bull cycle.
cointelegraph.com/ne…nk-price-to-rally-52
Analysis
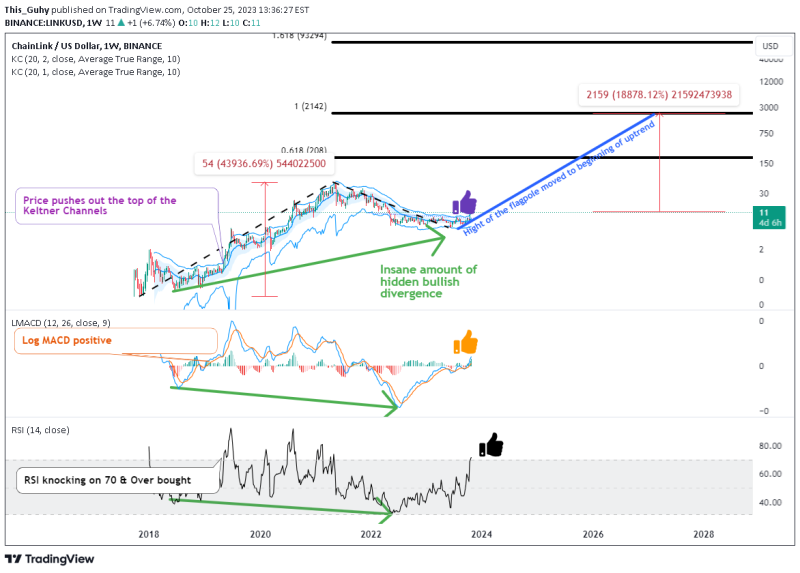
The meat of the idea is from the main chart. We have hidden bullish divergence on the log MACD as well as the RSI. Hidden bullish divergence suggest a uptrend will continue. There is a higher low on the price but a lower low on the indicator. The green arrows show that very clearly.
The RSI getting to above 70 can signal overbought on a time frame but it can also signal that the bulls are in control of the price action. The log MACD is above zero once again. Both are very bullish indications that momentum is shifting fully bullish.
I favor using two Keltner channels, one set with the ATR at 1 and one set at 2. It helps be visualize when price is in between and make some conclusions. In order to “break” a weekly Keltner channel we need months if not years of price action creating a formation we can play.
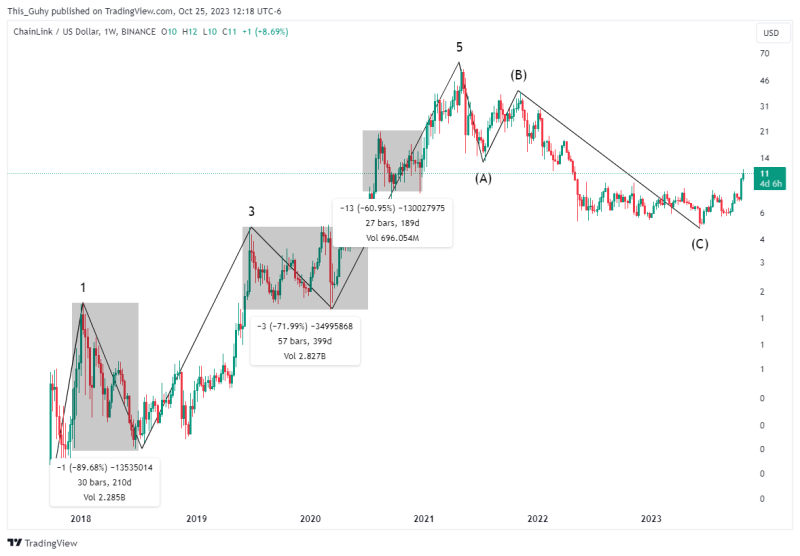
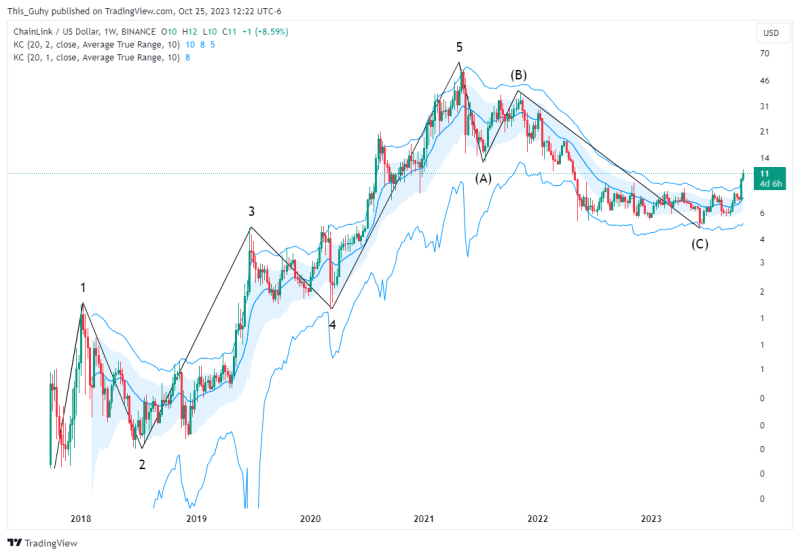
I am just going to keep it as simple as possible. Link had a Elliot wave impulse and has completed its ABC correction. That is the structure we need to break the Keltner channel and push it upward. The chart below shows that twice link lost over 60% of its value when it corrected. So there are going to be discounts on the way back up. These relative bear markets lasted several hundred days and that can really weaken people’s hands.
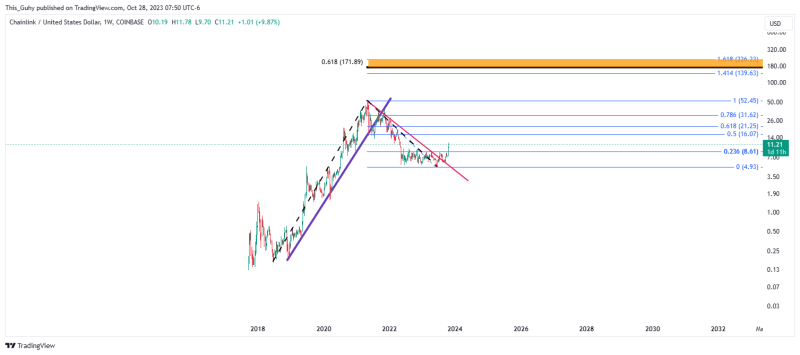
Since we are using elliot wave the primary targeting technique I am using is major fib extension levels. I have only shown a couple on the main chart for simplicity but I expect action at almost all major fib lines. Stalls, retraces, all the normal drama.
Looking to buy the lower half of the Keltner channels seemed to have worked out for long term investors between 2018 and 2021. It was only when we put in the lower high at point B that strategy meant you were out of the money for a long time.
My plan
I plan on having Link be a major holding going forward. I plan on watching some tokens against Link (sol, xmr, ftm, etc) and trying to do some rotations or buying the alts when they have bullishness against link. In the long run I hope to pull close to 200x out of link with no margin.
Comment: For those asking for a shorter time frame (like the next bullish cycle I would think closing in the golden box below would be a decent trade. That takes the blue fib draw and looks for confluence with the fib extension. And it is around the big round number of 200.
For comparison, here is how BTC acted around $200. It actually lanced up to over $250 on crazy volatility. The market was a lot smaller and faster at the time, but $200 or $250 should see similar psychology just due to people’s inclination to numerology.