
The price also rose from a shorter-term descending resistance trendline on September 29.
MATIC Reached Long-Term Resistance
The weekly timeframe technical analysis shows that the MATIC price increased considerably last week. The increase created a bullish, engulfing candlestick (green icon).
This is a type of bullish candlestick in which the entire previous period’s decrease is negated in the next period.
Even though the increase was considerable, the MATIC price still trades below the long-term $0.60 horizontal resistance area. This is a crucial area since it has intermittently acted as both resistance and support since May 2022.
When an area has been significant for such a long period of time, it can be used as a benchmark for the trend’s direction.
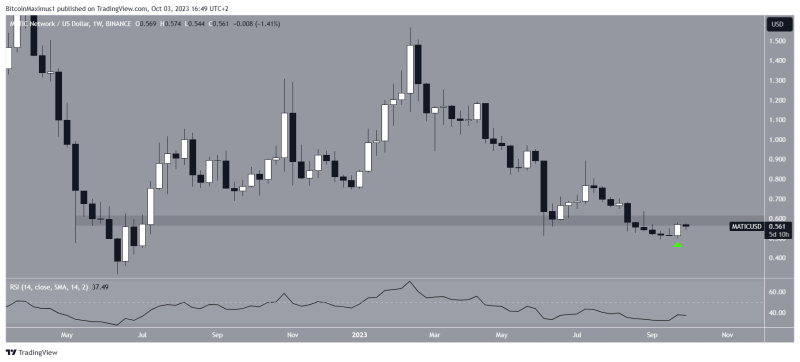
MATIC/USD Weekly Chart. Source: TradingView
The weekly RSI does not provide any clues as to the trend’s direction. When evaluating market conditions, traders use the RSI as a momentum indicator to determine if a market is overbought or oversold and to decide whether to accumulate or sell an asset.
If the RSI reading is above 50 and the trend is upward, bulls still have an advantage, but if the reading is below 50, the opposite is true.
While the indicator is increasing, it is still below 50. These mixed signs do not confirm the cryptocurrency’s trend’s direction.
MATIC Price Prediction: Has the Reversal Begun?
The daily timeframe technical analysis for MATIC is decisively bullish. On September 29, MATIC broke out from a descending resistance trendline in place since February 28, when the altcoin had just reached its yearly high at $1.57.
A bullish divergence in the daily RSI (green line) preceded the MATIC price breakout. A bullish divergence occurs when a momentum increase accompanies a price decrease. It often leads to significant bullish trend reversals, as was the case with MATIC.
Read More: Best Crypto Sign-Up Bonuses in 2023
Therefore, the MATIC price prediction is considered bullish due to the breakout from the resistance trendline and the bullish divergence in the RSI. If the increase continues, the next resistance at $0.85 is 50% above the current price.
Additionally, it is worth mentioning that Google Cloud joined the Polygon network as an official validator, staking over 10,000 MATIC.
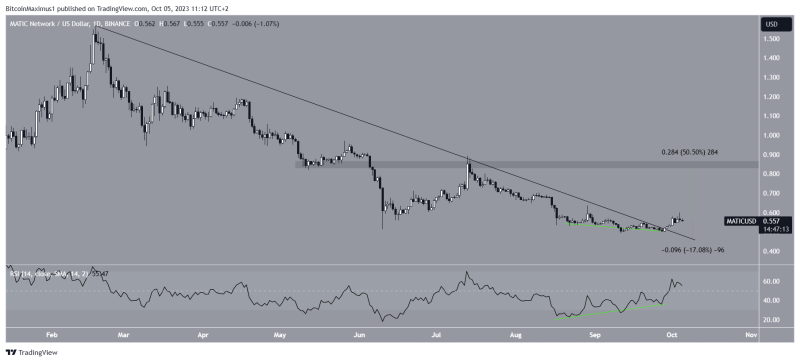
MATIC/USD Daily Chart. Source: TradingView
Despite this bullish MATIC price prediction, a close below the October 1 opening of $0.53 will require further retracement before the increase can continue.
In that case, MATIC can fall by 17% to the descending resistance trendline at $0.46.
Interested in AI Trading? 9 Best AI Crypto Trading Bots to Maximize Your Profits