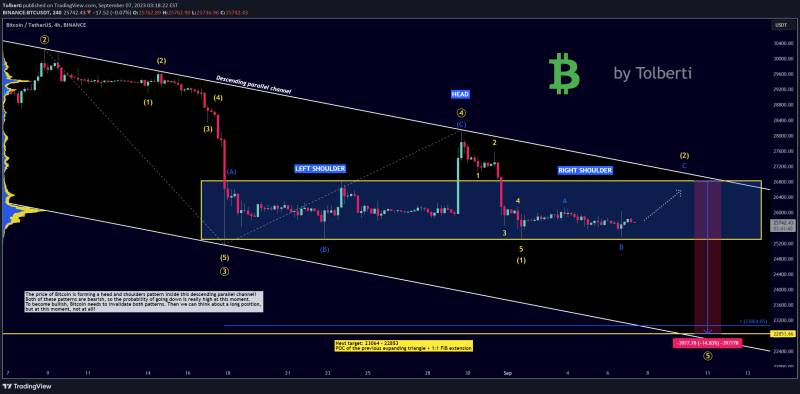
- The price of Bitcoin is forming a head and shoulders pattern inside this descending parallel channel! Both of these patterns are bearish, so the probability of going down is really high at this moment. To become bullish, Bitcoin needs to invalidate both patterns. Then we can think about a long position, but at this moment, not at all!
- You probably want to trade with a trend, and the trend is bearish on this particular timeframe. But in the immediate short term, we could go up to form the right shoulder of the major pattern; of course, that would be an excellent opportunity to short bitcoin at a great price!
- Where is the profit target for the big short? I already market it on the chart, and it’s between 23064 and 22853 because it is the POC of the previous expanding triangle + 1:1 FIB extension (wave 3 -> 4).
- As per my Elliott Wave analysis, last week we printed a new impulse wave, which is very clear and visible. Everything in confluence suggests that we are bearish, and continuation of the downtrend is extremely likely and almost definitely a guarantee. Sooner or later, we will break the support of 25k.
- This is my outlook on BTC for this month; do not forget to let me know in the comment section what you think about it and if you are prepared for another crash. I need to know your opinion!
- This analysis is not a trade setup; there is no stop-loss, entry point, profit target, expected duration of the trade, risk-to-reward ratio, or timing. I share my trades transparently and post trade setups privately.
- Thank you, and for more ideas, hit “Like” and “Follow”!